Forex Trading Articles
USING BOLLINGER BANDS FOR FOREX TRADING
(PART V)
By Teresa Burnett for Forexmentor.com
©
2007, Currex Investment Services Inc.
Jan 6, 2007
Prior to placing a trade we must be able to answer two fundamental questions. The first question is how far could price retrace and move against the trade. The second question is how far will price most likely move in the direction of the trade. The answer to the first provides us our stop, the answer to the second provides our price targets.
Additionally, once a movement in price has begun and a trend is established, it is profitable to know where the “second chance” or additional entry points are to be found.
Various techniques exist for calculating price targets depending on the indicator that signals a trade entry. For example, if we enter a trade based on a trend line break we have available trend line break price projections; if entering based on the break of a neckline in a head and shoulders pattern, we have available the head and shoulders price projection; similarly we have available the M1/M2 paradigm as taught in the ForexMentor currency trading course for calculating price targets based on pivots.
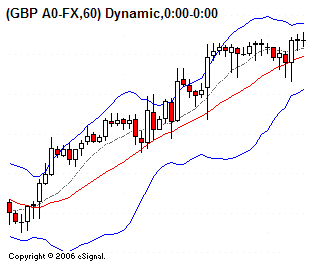
Bollinger Bands are also quite useful for calculating price targets when used alone or paired with other indicators such as a moving average. For example, Illustration 1 shows a strong uptrend. Price has retraced, but only minimally.

Illustration 1
Viewing this uptrend in light of the Bollinger Bands shows that price has not closed lower than the middle Bollinger (which in this example is a simple 20 period moving average). Indeed any movement down to the middle Bollinger has provided opportunities to exit any countertrend short plays and to buy dips in the uptrend.
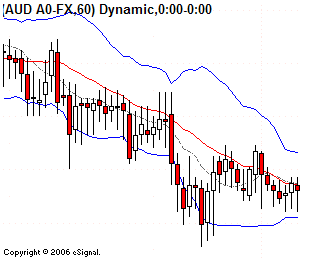
In the downtrend shown in Illustration 2, price has rallied up to the middle Bollinger with opportunities to exit any countertrend long trades and to sell the rallies at these points.

Illustration 2
What clues do the Bollinger Bands provide that these trends would continue in spite of the retracements? The steepness of the angle of the upper, lower, and middle Bollinger Bands indicate this. Additionally, a shorter moving average, which in these examples is a simple 10 period moving average plotted as a dashed line, indicates the trend would most likely continues since it too has a steep angle and is above the middle Bollinger in the uptrend and below the middle Bollinger in the downtrend.
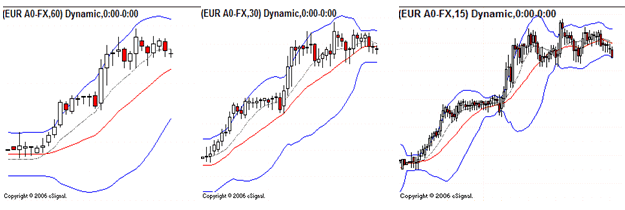
It is also important to mention that these points where price finds support or resistance in a strong trend differ based on the chart’s time frame. For example, in Illustration 3, the same section of an uptrend is plotted in a 60 minute chart, a 30 minute chart and a 15 minute chart. In the 60 minute chart, price has found support at the 10 period simple moving average; in the 30 minute chart these support points correspond to the middle Bollinger; and in the 15 minute chart these points of support correspond to the lower Bollinger Band.

Illustration 3
This information is useful for a couple of reasons. First, when we notice price respecting a Bollinger Band or moving average on a higher time frame chart, we can examine a lower time frame chart to time entry and exit points. Secondly, we can monitor lower time frame charts for a break of the opposite Bollinger Band which provides an early warning that the trend could be ending. In other words if in an uptrend price retraces past the 10 period simple moving average, the middle Bollinger Band, and the lower Bollinger Band it is a good indication the uptrend is weakening since three levels of support have been broken.
Eventually, all trends no matter how strong or how long they have been in effect will falter. Frequently after a currency pair trends up or down, the pair will consolidate or channel prior to a trend reversal or continuation. In the next section we will explore this consolidation phase in further detail and how Bollinger Bands can provide clues as to which way a consolidation will break.
Proceed to the next section
Index of Other Forex Trading Articles
Find Out How the 'Big Dogs' Got Rich Trading Currencies & What Secrets They Are Hiding From You...

|
