Forex Trading Articles
USING BOLLINGER BANDS FOR FOREX TRADING
(PART VI)
By Teresa Burnett for Forexmentor.com
©
2007, Currex Investment Services Inc.
Jan 7, 2007
In this section we will explore price consolidations and channels in further detail and how Bollinger Bands can provide clues as to how to trade these patterns.
Consolidations
Technically speaking, consolidations are periods of low volatility when price is range bound, i.e., not making higher highs as in an uptrend nor lowers lows as in a downtrend. Fundamentally speaking, consolidations form during the quiescent phases in the daily trading or monthly news cycles, or after steep up or down movements in price.
During a consolidation phase, it is useful to have an indication of which way price will break out of the consolidation. Illustration 1 shows several consolidations that broke in different directions.
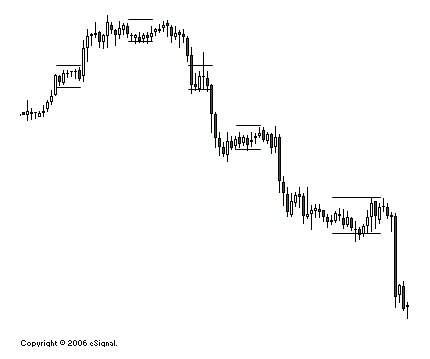
Illustration 1
These above consolidations show upside, neutral, and downside bias when plotted with Bollinger Bands and a 10 period simple moving average (Illustration 2).
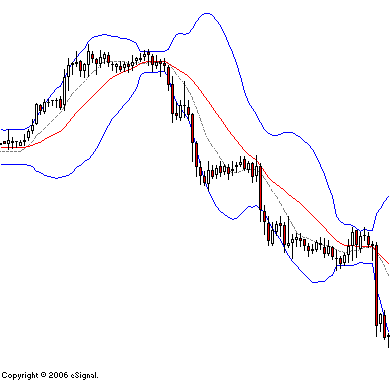
Illustration 2
In the above examples the middle Bollinger and short term moving average provide the clues to the eventual breakout direction. In general, when both Bollinger Bands are wide and up sloping with a similar up sloping angle in the 10 simple moving average, the consolidation has a bias to break to the upside. When the Bollinger Bands are wide and down sloping with a similar down sloping angle in the 10 simple moving average, the consolidation has a bias to break to the downside. When the Bollinger Bands are flat and narrow and the 10 simple moving average is also flat, the bias is neutral which means the trend has the potential to reverse or to continue. When the consolidation is neutral, other indicators should be employed to gauge the breakout bias. In Illustration 3, MACD and Stochastic alert us to the downside potential in these two particular neutral consolidations.
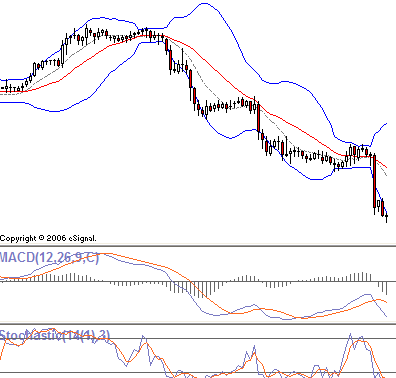
Illustration 3
Channels
A channel is a trend with price action moving between parallel lines drawn over the highs and the lows (Illustration 4).
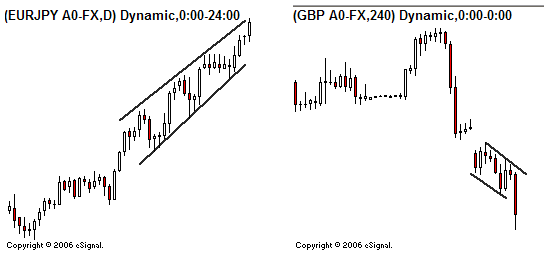
Illustration 4
Channels form when both support and resistance are strong. Therefore channels provide opportunities for both trend and countertrend trades.
In recent price action in the EUR/JPY currency pair, price found support at the daily 10 simple moving average as price moved in a strong uptrend (Illustration 5). The steep upward slope of the 10 moving average and the Bollinger Bands indicated the uptrend would hold during the dips in price which provided good counter trend plays.
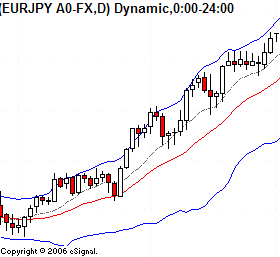
Illustration 5
During this channel phase, the four hour chart provided trade entries indicated by MACD divergence and neutralization, consolidations with upside or neutral bias, support at the daily 10 moving average and lower Bollinger Band, and the eventual break out of the channel when price closed below the daily 10 moving average after a neutral consolidation indicated a potential change in trend (Illustration 6).
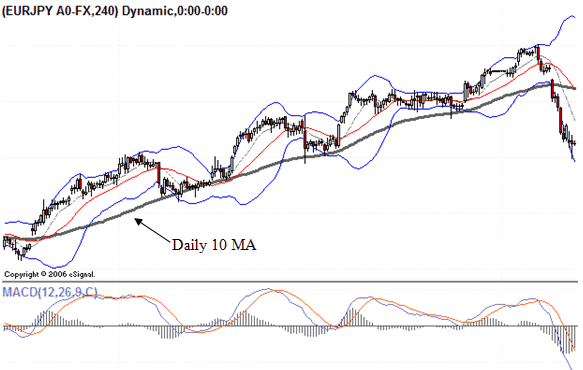
Illustration 6
In this series of Bollinger Band articles we have discussed using Bollinger Bands for timing trade entries using the slope of the bands and the bands in combination with other indicators. In the next series of articles we will continue to explore trends, in particular the large up or down trends that form in the aftermath of major news announcements and the opportunities these trends provide for trade entries.
Coming soon “Trading the News”.
More Bollinger Band Strategy Articles | Other Forex Trading Strategy Articles
Find Out How the 'Big Dogs' Got Rich Trading Currencies & What Secrets They Are Hiding From You...

|
