Forex Trading Articles
USING BOLLINGER BANDS FOR FOREX TRADING
(PART IV)
By Teresa Burnett for Forexmentor.com
©2006, Currex Investment Services Inc.
Dec 14, 2006
In this section, we will briefly illustrate the use of Bollinger Bands combined with other indicators to confirm trade signals.
The key to using multiple indicators to confirm signals is to ensure they are derived from different aspects of price movement, (i.e. trend, momentum, and overbought/oversold). The indicators as taught in the Forexmentor currency trading course (MACD, pivots, Stochastic, RSI, etc.) certainly meet those criteria. The strength of Bollinger Bands as an additional confirming indicator is that they can show emerging support or resistance points. This allows us to monitor those price points and to plan a trade in advance.
For example, after a run up in price, the USD/CAD currency pair retraced and seemed to find support, poised for another move up. This point of support was telegraphed in advance by an emerging flat lower Bollinger Band in the 4 hour chart (Illustration 1).

Illustration 1
This price area also corresponded to a 50% Fibonacci retracement followed by a close above the 38% retracement level, and a touch of the M2 pivot point on a day when M2 was the expected low. The lower time frame 15 minute chart shows these as well as a reversal candle pattern and trend line break to the upside. Each of these indicated that price would continue up, which indeed it did over the next several days.
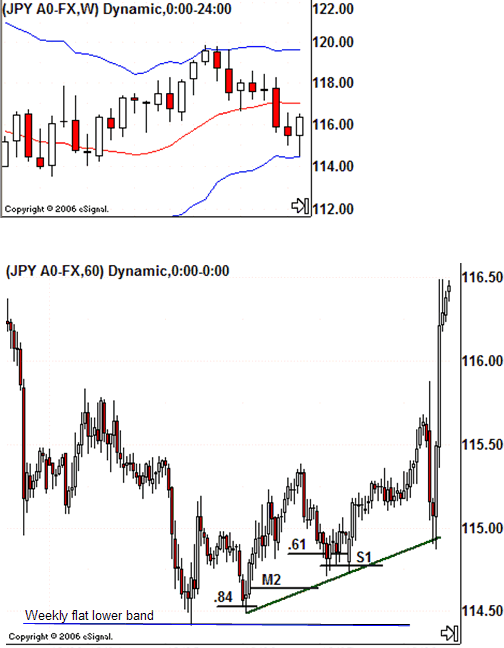
In late November and early December, 2006 the USD/JPY weekly chart showed a forming flat lower Bollinger Band (Illustration 2) which could be seen days in advance.

Illustration 2
The eventual touch and reversal off the point corresponding to the weekly chart flat lower Bollinger Band price point was neat (price did not move far below it) and swift as seen in the 60 minute chart also in Illustration 2. The question, “Would price reverse to the upside from the flat lower band or continue down?” was soon answered as the new uptrend was repeatedly confirmed with touches of pivot points, Fibonacci retracement, and Stochastic indicating oversold. Once again, the flat lower Bollinger Band as seen on the weekly chart indicated a potential reversal point well in advance and was confirmed by the other indicators in our toolkit.
In the next section (coming soon) we will discuss using Bollinger Bands to determine price targets.
Proceed to the next section
Index of Other Forex Trading Articles
Find Out How the 'Big Dogs' Got Rich Trading Currencies & What Secrets They Are Hiding From You...

|
