Forex Trading Articles
USING BOLLINGER BANDS FOR FOREX TRADING
(PART III)
By Teresa Burnett for Forexmentor
©
2006, Currex Investment Services Inc.
Dec 7, 2006
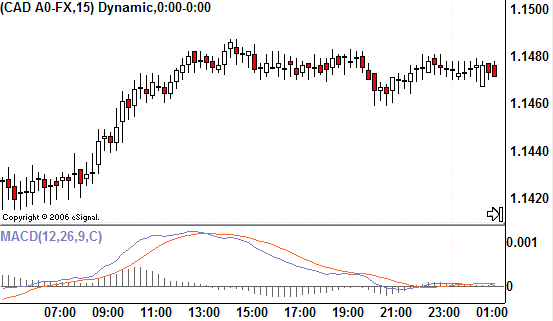
After a currency pair experiences a large up or down movement in price, the pair will most often consolidate or channel. This can be seen in a 15 minute chart as a sideways movement in price as MACD neutralizes to the zero line (Illustration 1). These periods of price consolidation present opportunities for what is known as “scalping” or taking shorter term positions for 15 or fewer pips.

Illustration 1
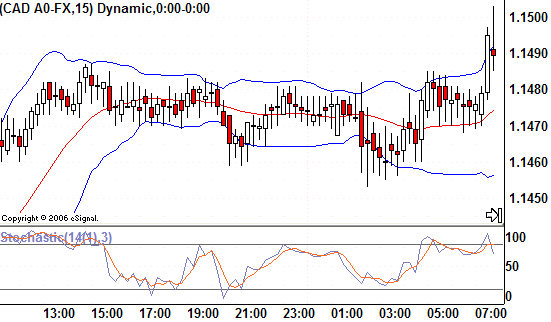
The technique discussed in the first section of this article can help time the entry and exit of shorter term currency trade positions during this sideways movement as price will be moving between flat, nearly parallel Bollinger Bands (Illustration 2).

Illustration 2
There is some disagreement amongst Bollinger Band enthusiasts if a touch of one band indicates price will move to the opposite band. In my experience, after a steep upward or downward movement in price, the currency pair will begin to channel, the Bollinger Bands will flatten, and then there is a high probability that at least several back and forth movements between the upper and lower bands will occur.
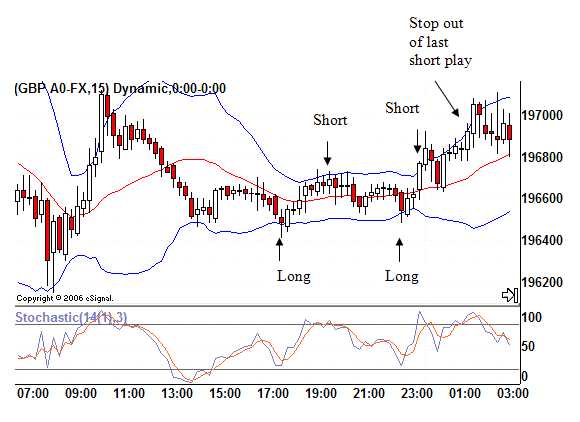
Illustration 3 shows long positions taken when price is at the flat lower Bollinger Band and an oscillator (in this example Stochastic) shows oversold. Long positions are exited when price touches the flat upper Bollinger Band and the confirming oscillator shows overbought. Conversely, short positions are taken when price touches the flat upper Bollinger Band and the confirming oscillator shows overbought. Short positions are exited when price is at the flat lower Bollinger Band and the confirming oscillator shows oversold.

Illustration 3
The most profitable short term trading setups occur when the upper and lower bands have sufficient width (as measured in pips) to allow for the bid/ask spread and a profit. Although this channeling between Bollinger Bands can often be seen on 5 minute and 15 minute charts, the narrowness of the bands in the 5 minute chart does not always produce a worthwhile profit.
High probability setups for price channeling to occur are several hours after a news announcement, for example the period of time on the Friday of the non-farm payrolls report after the London close and prior to the New York close when the energy behind the steep upward or downward momentum caused by the report has dissipated. Obviously, price will not “ping-pong” between the upper and lower bands forever. Price will eventually break out above or below the bands requiring a nimble exit of any trades contrary to the breakout and the prudent use of stops. Also it is worth noting that if trades are taken when price is channeling prior to a news announcement those trades should be exited before the news announcements as the news can cause a huge price spike, the direction of which is virtually impossible to predict.
Proceed to the next section
Index of Other Forex Trading Articles
Find Out How the 'Big Dogs' Got Rich Trading Currencies & What Secrets They Are Hiding From You...

|
