Forex Trading Articles
USING BOLLINGER BANDS FOR FOREX TRADING
(Part II)
By Teresa Burnett for Forexmentor
©
2006, Currex Investment Services Inc.
Dec 6, 2006
In the introductory section of this article (see here) we explored a technique for using the slope of the Bollinger Bands to predict price reversals when trading currencies.
One of the examples presented in the first section was a price reversal indicated by a flat upper Bollinger Band on a USD/CHF weekly chart. Timing a trade entry using a longer term time frame such as a weekly chart can and does require a larger stop loss. In this section we will explore using a lower time frame chart to time trade entries when the technical setups occur on a higher level chart. Timing a trade entry from a lower term time frame requires a much smaller stop.
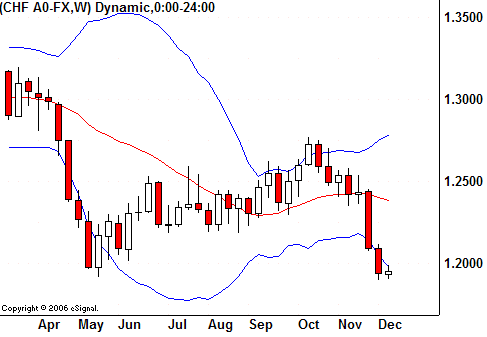
Using the same USD/CHF weekly chart from the first section (Illustration 1), we can see in September and October, 2006 multiple touches of a flat upper Bollinger Band, a close outside the flat upper band, followed by a close inside the upper band. Placing a sell order at the flat upper band at the first touch would have required a stop of 100 or more pips to stay in the trade and ride out the volatility until the subsequent drop in price was underway.

Illustration 1
However, timing a sell order from the 60 minute chart (Illustration 2) presented multiple trade entry points with much lower risk requiring stops of only 10, 20 or 30 pips. Three such sell points using a variety of forex trading strategies and technical indicators are noted.

Illustration 2
On a fundamental note, the commercial traders, as reported by the COT futures data, were extremely long the Swiss Franc during this time period which also supported taking a short position in the USD/CHF pair (Illustration 3).

Illustration 3
When these flattened Bollinger Bands are forming on higher time frame charts, for example, from a four hour chart up to a daily or weekly chart, they can take days or weeks to play out. Therefore, they present wonderful opportunities to set alerts and to draw lines/rays at these price points on the 60 minute or 15 minute charts to begin to look for a convergence of technical indicators in favor of the trade at a future time.
In the next section we will discuss using the slope of the Bollinger Bands to time intraday trades.
Proceed to the next section
Index of Other Forex Trading Articles
Find Out How the 'Big Dogs' Got Rich Trading Currencies & What Secrets They Are Hiding From You...

|
