Forex Trading Articles
THE TRADING EDGE
By Dick Thompson for Forexmentor.com, ©2008
July, 2008
Most of us, when we are “newbie’s”, have the perception that trading is easy, or at least it is not rocket science. We think that we can acquire a certain basic knowledge, both fundamental and technical, then find a methodology and start trading. Most of us quickly get a rude awakening when we find that our account does not grow as we had expected it to. Interesting enough, in our search for the reason for our failure, we choose not to revisit the total experience noted above, but to focus on the methodology with which we had selected to trade. Why? I am not really sure. Perhaps it is because our newly gained fundamental and technical knowledge is learned and the methodology is generally acquired from some outside source. A trading system, if you will.
Most traders, including myself, at one time or another spend a great deal of time and energy trying to resolve the initial trading failures by looking for a system. The idea is that if we can just find a system that works, that fits our newly discovered style of trading, we will be successful. We quest for that holy grail.
I submit to you this thesis, that the most significant problem the new forex trader faces is getting over the idea that a trading system is a necessary ingredient to successful trading. If you were to “Google” the words “Forex Trading Systems”, you would receive approximately 1,400,000 hits. That should give you an idea of how many individual trading systems might be out there. Most of these systems were developed by traders, some who are very successful traders, and some who are unable to trade, however are great salesmen. Some of these systems work, some don’t. Some will work under certain market conditions, then when conditions change, no longer work. Some work for the developer because he or she just happens to be an expert trader and could make any system work, but is unable to incorporate that internal expertise into the system. Finding a trading system is a huge, daunting undertaking, and after a number of years going down this path, I have concluded that this is the wrong approach. I think that the correct approach is to learn how to trade. Sounds very glib, doesn’t it? But if you know how to trade, if you understand the market, if you understand how price moves and what causes it to move, then YOU CAN MAKE ANY SYSTEM WORK.
I have been fortunate over the years to become acquainted with a number of very fine, professional traders. Some are authors, some are teachers, and some are fund managers. Many of their names are well known. What is important is that they all have certain common characteristics. I will not go into detail on this; there are some very fine books written about some of these people. But briefly it comes down to this:
- They understand their markets, forwards and backwards.
- They understand themselves as traders
- They are disciplined
- They know what they are looking for in the markets for their trade
- They have an edge.
This skill set was not acquired overnight. These people worked long and hard, sometimes for years, to develop their abilities. Some do trade with what could be called a system. Most that I know do not. Whatever you want to call it, these traders own it. It is theirs.
In this article I want to address only one part of this list and that is the “edge”. The reason is that I think having an edge is critical to any methodology, any system, any approach to trading. It is the edge that gives the trader a probable outcome from a trade. Ask yourself this: instead of spending time searching for trading systems, what if you could prove to yourself, over and over again, that a given edge is consistent in yielding a given outcome? Could you then figure out for yourself a method of trading with that edge that could be successful?
What is an “edge”?
- An edge is a set of circumstances that when present, will result in a given outcome with a better than average probability.
- These circumstances must be unique and well defined.
- These circumstances must be recognizable.
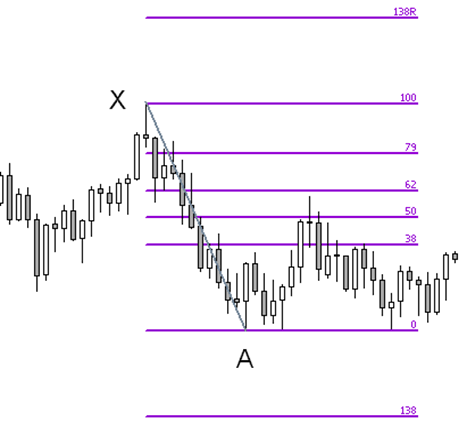
I am going to outline an experiment for you to do. You will need nothing more than a basic charting program such as most of you have on your trading platform. It must have a Fibonacci Retracement tool. You will have to modify the Fib tool to add a Fibonacci extension to both ends, as in the following picture:

Figure 1
This Fib is pulled down along the swing from X to A with the normal retracement values (38%, 50%, 62%, and 79%) tracing back up and extending beyond X (which is a 100% retracement) to a 138% retracement, designated as 138R. Also, there is an extension of the X – A swing, in the same direction as the swing, and with the value of 138% of the X – A move. That is the 138 value beneath A.
(I call this out in some detail because there are many traders who do not use the Fib tool in this manner. It is easy to modify your tool to show this value; if you do not know how, please contact your broker or technical support for your individual trading platform.)
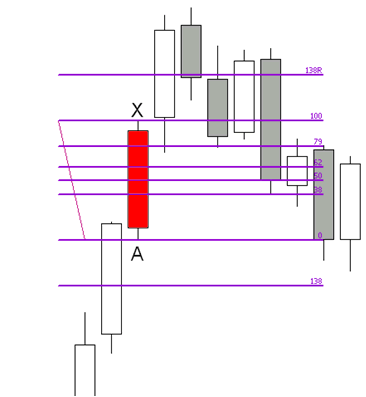
Once you have configured your Fib tool in this manner, apply the tool to any currency pair in a weekly chart. Move back in time on the chart to sometime in early 2007 (just to get enough sample data to be statistically significant). Pick any single weekly candle (use candles to represent price, as they are much easier to see in this exercise) and apply the Fib tool from the top wick to the bottom wick. It will look like this:

Figure 2
This Fib has been drawn from the top of the red candle to the bottom. For this exercise, the Fib can be drawn from the top down or the bottom up. We will only be concerned with the 138% extensions so it does not make any difference. Please refer to Figure 2 above for the remaining discussion.
The rules of the experiment are as follows:
- Draw a Fib on a completed weekly candle. We are only going to be interested in the 138% Fib extensions, so note their levels.
- When price movement on a following candle penetrates either end of the completed weekly candle, the game begins. For instance, in Figure 2 above, the candle following our red candle penetrates the price represented by the top of the wick on the red candle, price level X (sometimes it will take more than one candle before price penetrates the top or bottom, or completes the cycle to the extension. This is OK).
- If price moves to the 138 extension in the same direction as the penetration, before it retraces to the other end of the completed weekly candle, we have a win; otherwise, we have a loss . (The candle following our red candle continued up and the price exceeded the 138% extension.)
- After each win or loss, we will draw a new Fib on the completed weekly candle that contained either the 138% level reached, or the reversal to the penetration of the opposite end of the original candle. (In the case of the Figure 2, the candle immediately following the red candle achieved a win and hence is considered the last completed candle. So the next Fib would be drawn on it.)
The result that I have seen is that there is a probability of somewhere between 70% and 90% that once price penetrates one end of the candle or the other, it will reach the 138% extension before it retraces and penetrates the other end of the candle. That, folks, is an edge.
You can carry this experiment for as many candles as you wish. Use as many currency pairs as you wish. My goal is that you convince yourself that the conclusion is valid. It is important that you do this yourself and not take my or anyone else’s word for this. You must internalize it and know that it is valid. Only then can you proceed. If you do come to this same conclusion, could you then see yourself developing a trading methodology to take advantage of this probability, this edge?
Trading off of a single weekly candle does not sound like an easy task, so what might the next step be? Consider our process so far; we drew a Fibonacci Retracement across a single candle. But Fibonaccis are normally drawn across swings, from a swing low to a swing high for instance. Swing lows and highs are quite often support and resistance levels. So lets make the leap that we might investigate using a Fib drawn between support and resistance and look at the 138% extensions on that Fib.
Using the rules above as a guide, we might come up with the following:
- With any currency pair in the one hour chart, select a clearly seen swing from a support to a resistance level (or vice versa).
- Using our Fib tool, draw a Fib from the support to the resistance level. Note the price level of the 138% extensions both up and down.
- When price penetrates the support or the resistance, that establishes the direction of the possible trade.
- If price reaches the 138% extension in the direction of the penetration, consider this a ‘win’. If price reverses before reaching this level and instead, retraces all the way back to the opposite end of the swing, consider this a ‘loss’.
- Once a win or loss has been recorded, locate the next support or resistance level just beyond the 138% extension and anchor the right end of the Fib there. Locate the left end to the preceding swing high or low.
These rules are brief and simple. You might expand these with your own preferences, such as how you will define a penetration; whether or not you will allow a tolerance on reaching the 138% extension level; how many candles you will allow to complete without reaching the 138% extension before you consider the sample void and look for another swing.
If, after experimenting for some time, you are beginning to think that this truly might be a viable edge in the market, you might begin thinking about how you might trade it. How would you enter the market once there is a penetration? How would you handle the possible pullback into the range after a penetration (some swings might be quite large which could result in a large drawdown if price reversed to the opposite end of the swing)? How will you treat the proximity of other support and resistance levels that might be in confluence with your swing and extension levels? What time frame might offer the best trading considering your personal trading personality and style preferences?
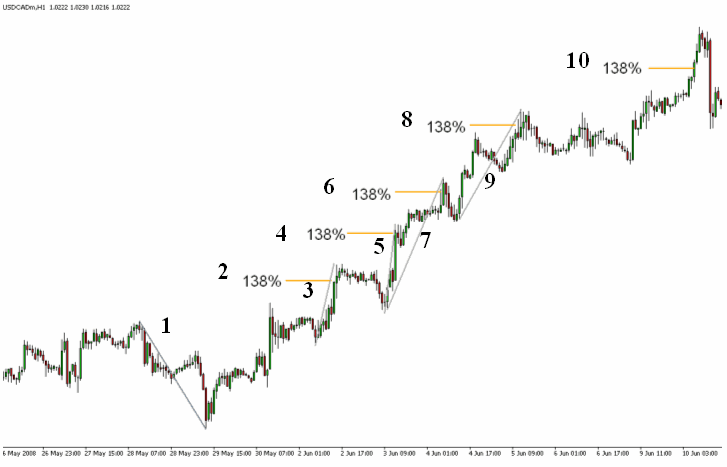
The following Figure 3 is an experiment that I conducted on the 1H chart using the USDCAD.

Figure 3
Follow me through on this experiment.
- I started with the swing at the lower left of the Figure.
- The 138% extension was reached as shown
- I drew the next Fib from the resistance just above that first extension, anchoring it at the swing low support level behind it.
- That Fib reached its extension as shown.
- The next Fib was drawn as shown.
- That Fib reached its extension as shown.
- The next Fib was drawn without changing the lower anchor from the last swing.
- That Fib reached its extension as shown.
- The next Fib was drawn as shown.
- That Fib reached its extension as shown.
This was quite successful and to me quite compelling. Five wins in five attempts based on a random selection of pair and time. Of course, the details of entries, management, and so forth are not addressed and as we know the devil is in the details. They are critical.
If you have made it this far in this experiment, you should stand back and take stock of what you have accomplished. If you have personally conducted a couple of these experiments and found evidence of an edge in the market, and then you have spent some time thinking about how you would develop a method of trading based on that edge, you have taken a giant step beyond many other traders. You have defied human nature; you have done the work yourself. There is still a huge amount of work to be done; there is no question about that. However, you have taken control of your trading and you have begun learning how to trade. You have started to experience how price moves; how the market flows. You are no longer searching for a holy grail, you are creating a method for yourself. When you have it, you will own it. It will be yours. You will know how to trade and you will not need a system. And you will be successful.
Larry Pesavento said “Trading is a journey, not a destination”. And there is nothing more true. Good luck.
Note: The weekly chart experiment described in this article was first presented last year in a ForexFactory forum on trading. This material is still in the public domain and can be accessed for further study at:
Indicator Free Trading Link http://forexfactory.com/showthread.php?t=60272
Index of All Forex Trading Articles |
|
