Forex Trading Articles
USING MACD AS AN AID IN DETERMINING TREND DIRECTION
By Vic Noble for Forexmentor.com
©
2006, Currex Investment Services Inc.

Dec 13, 2006
MACD is a technical indicator that is widely available on most charting services, and it stands for Moving Average Convergence/Divergence. Although it is a lagging indicator that plots a comparison of a short term and a long term moving average, it does represent a momentum oscillator that, when used properly, can be very effective in helping determine trend movements, including reversals.
One of the most common problems that traders is getting the direction right, and I’d like to show you an example of how traders frequently misinterpret price action because of a flawed use of MACD.
I use MACD in one of two ways—to indicate a price trend continuation, or to signal a possible trend reversal.
Today, I’m going to focus on trend continuation, and how false signals can be generated by making the common mistake of only focusing on the lower time frames.
One of the problems that many traders run in to with MACD and other technical indicators is that they fail to make multiple time frame assessments. Of particular importance is that the higher time frames are much more important than the lower time frames in terms of reliability. The following charts will illustrate how this plays out.
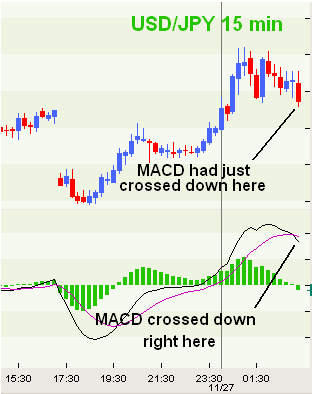
The chart below is a 15 minute time period on the USD/JPY currency pair. Notice how MACD had just crossed below its signal line at the point indicated on the chart.

Many people believe that this is a selling opportunity. This is a very limited way to look at this situation. You should NEVER look at charts in isolation! In other words, check all of the other time frames before making a trading decision.
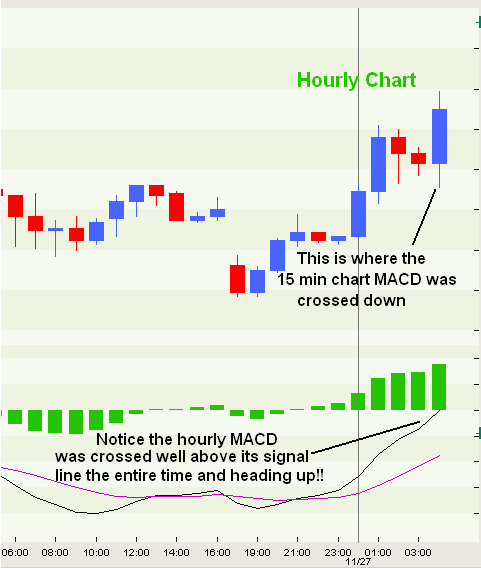
Now take a look at the chart below and see what MACD was doing on the hourly chart on this currency pair at the same time.

What a difference! Not only was this NOT a good place to sell (as the 15 min MACD would have you believe), but it was in fact a very good, high odds set up to buy! All you had to do was consult the higher time frame, in this case, the hourly chart, and together with some other tools, which will be the subject of other topics, you could easily have entered this as a buy. And just so you know, the ensuing move was worth over 40 pips!
So, always keep an eye on the higher time frames—you’ll be glad you did!
All the best,
Vic Noble
Forexmentor Personal Coach
http://www.forexmentor.com/coaching/
More Articles on Using MACD to Trade the Forex
Index of Other Forex Trading Articles
Find Out How the 'Big Dogs' Got Rich Trading Currencies & What Secrets They Are Hiding From You...

|
